The NCERT Class 12 Microeconomics Chapter 5, Market Equilibrium, is all about understanding how prices and quantities are determined in a perfectly competitive market. It explains how demand and supply interact, and what happens when there is a mismatch between them. The chapter includes concepts like excess demand, excess supply, price ceilings, and price floors. These concepts are supported with diagrams and real-life examples, making them very important from both exam and practical points of view.
I’m writing about this topic because many students often get confused when it comes to applying the concepts of equilibrium in graphs and case-based questions. Chapter 5 is also commonly used in board exams and entrance exams like CUET. Whether you’re a student or teacher, it helps to have a simplified understanding and access to the official NCERT PDF. Plus, with recent changes in syllabus and updated NCERT layouts, it’s important to have the correct and updated version of the chapter in hand. That’s why I’m sharing both a breakdown of the chapter and a direct official download link at the end.
What is Market Equilibrium?
Market equilibrium happens when the quantity demanded by consumers equals the quantity supplied by producers at a particular price. This price is called the equilibrium price, and the quantity is called the equilibrium quantity. At this point, there is no tendency for the price to change, unless there is an external shock.
The basic condition for market equilibrium is:
Quantity Demanded = Quantity Supplied
If the price is higher than equilibrium, supply exceeds demand, leading to excess supply. If the price is lower, demand exceeds supply, causing excess demand.
Key Concepts Covered in Chapter 5
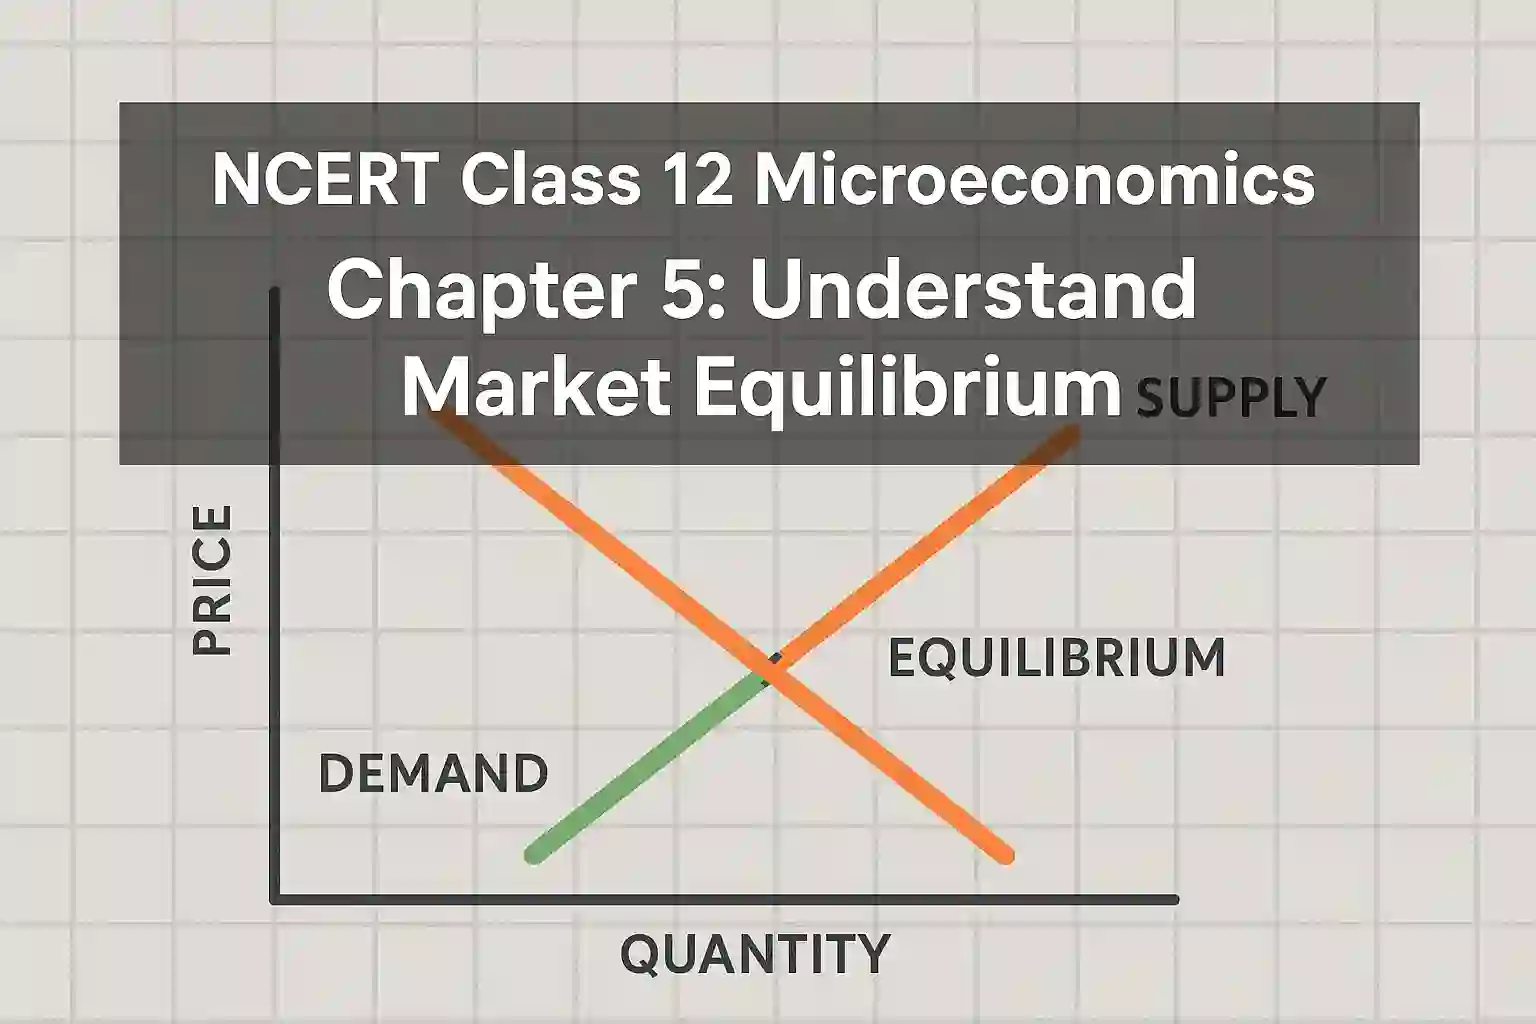
1. Equilibrium Through Demand and Supply Curves
- Graphical approach using the intersection of demand and supply curves
- Equilibrium price and quantity are determined at this point
- Effects of shift in demand or supply on equilibrium
2. Changes in Equilibrium
- Increase in demand shifts the demand curve rightward → higher equilibrium price and quantity
- Decrease in demand shifts it leftward → lower price and quantity
- Similarly, changes in supply affect equilibrium in the opposite way
These shifts are explained with the help of graphs, which are important from the exam point of view.
3. Price Ceiling and Price Floor
The chapter also discusses government interventions in the market:
- Price Ceiling: Maximum price fixed by the government (e.g. rent control)
- Price Floor: Minimum price set by the government (e.g. minimum support price for farmers)
These interventions often lead to excess demand or excess supply and are tested in both objective and descriptive questions.
4. Effects of Shocks and Policies
The chapter includes real-life examples of how events like droughts or government taxes can disturb equilibrium and how the market adjusts to a new one.
For example, if onion crops fail due to poor rainfall, the supply curve shifts left, increasing the price. This is how economics explains what we see in news headlines.
Tips to Understand and Prepare This Chapter
- Focus on graphs and learn how to explain shifts in curves
- Understand the difference between movement along the curve and shift of the curve
- Solve NCERT in-text and exercise questions
- Try to relate it to real examples like LPG subsidy (price ceiling) or MSP (price floor)
This chapter is concept-heavy but scoring if you practise the diagrams properly.
Download NCERT Class 12 Microeconomics Chapter 5 PDF
You can download the official NCERT PDF for Chapter 5: Market Equilibrium from here. The PDF is free and updated as per the latest CBSE syllabus.