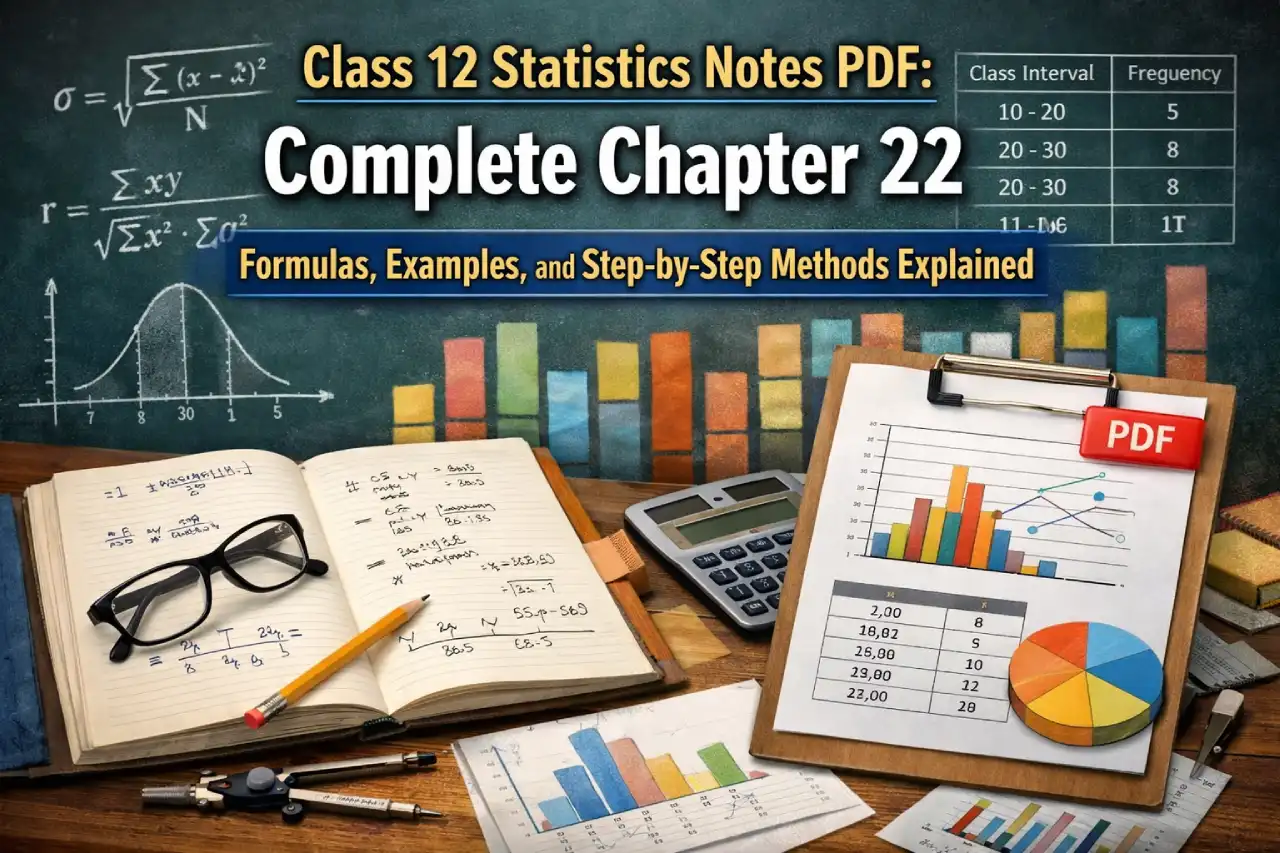
Statistics is one of the most scoring chapters in Class 12 Mathematics when students understand the formulas clearly and know how to apply them correctly. The uploaded PDF focuses on Chapter 22 – Statistics and provides a well-organised collection of definitions, formulas, worked examples, and methods related to measures of central tendency, dispersion, correlation, and regression. It acts as a compact notes booklet that students can use for learning, revision, and exam practice.
I am writing about this PDF because many students feel overwhelmed by the number of formulas in Statistics and often struggle to remember which formula to use in which situation. This document simplifies that process by presenting concepts in a structured way, supported with examples and clear explanations. Knowing what this PDF contains and how to use it can save valuable study time and improve accuracy in board and competitive examinations.
Overview of Chapter 22 – Statistics
The PDF begins with chapter objectives and clearly states that the chapter covers:
- Measures of dispersion
- Mean, median, mode for grouped and ungrouped data
- Quartiles, deciles, and percentiles
- Variance and standard deviation
- Correlation and covariance
- Regression and regression equations
This wide coverage ensures that students get all essential topics of the Class 12 Statistics syllabus in one place.
Important Definitions Explained in the PDF
Some basic statistical terms are explained at the start, such as:
- Class interval
- Frequency and cumulative frequency
- Discrete frequency distribution
- Continuous frequency distribution
- Primary and secondary data
- Variable or variate
These definitions help students build a strong foundation before moving to numerical problems.
Measures of Central Tendency
The PDF explains three main types of mean:
- Arithmetic Mean
- Geometric Mean
- Harmonic Mean
Formulas are provided for ungrouped data, discrete frequency distribution, and grouped data using direct method, shortcut method, and step deviation method. Weighted arithmetic mean is also included.
Median is explained for both ungrouped and grouped data, including the standard formula for continuous frequency distribution.
Mode is explained for simple data as well as grouped data, along with the formula using lower limit, class interval, and frequencies of modal, pre-modal, and post-modal classes.
The important relationship among mean, median, and mode is also included.
Download this CLASS 12 – STATISTICS PDF File: Click Here
Measures of Dispersion
The PDF explains why dispersion is important and introduces:
- Range
- Mean deviation
- Variance
- Standard deviation
Formulas for variance and standard deviation are given separately for ungrouped and grouped data. Worked examples show how to calculate these step by step, which is very helpful for self-study.
Quartiles, Deciles, and Percentiles
The document explains how data can be divided into parts using:
- Quartiles (Q1, Q2, Q3)
- Deciles (D1 to D9)
- Percentiles
Formulas for continuous distributions are given along with explanation of symbols like N, l, f, C, and h.
These topics are important for interpretation-based questions in exams.