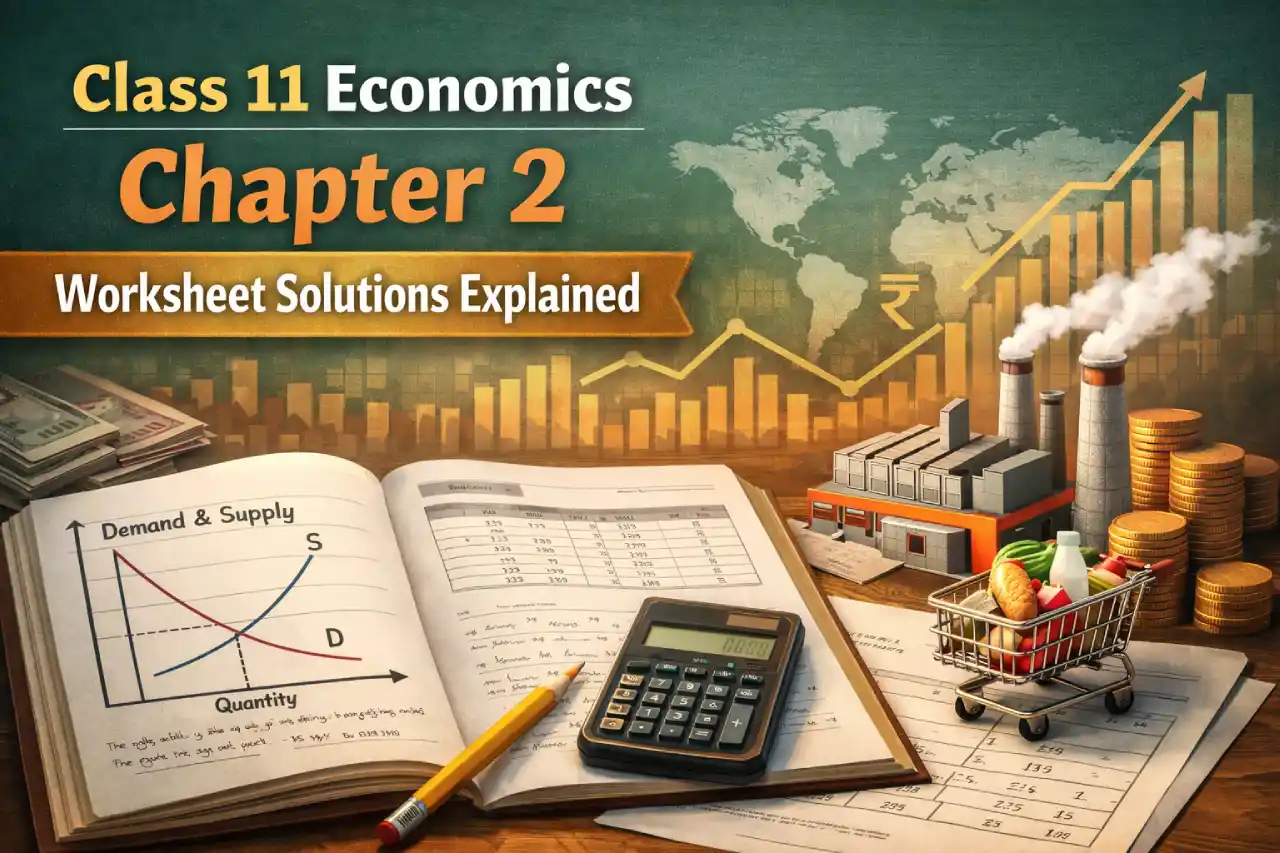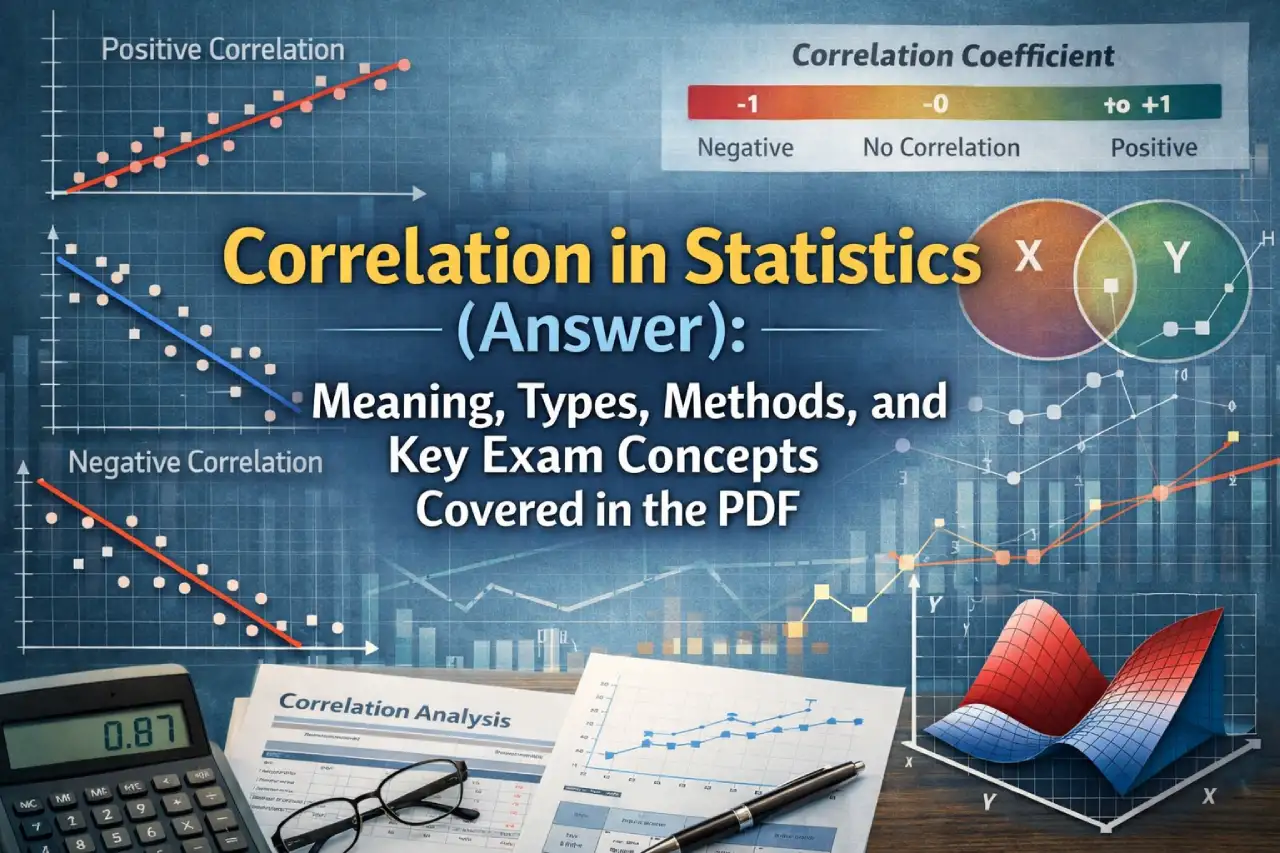
Correlation is an important chapter in statistics that helps students understand how two or more variables are related to each other. The uploaded PDF is a detailed answer-based question bank focused entirely on the topic of Correlation. It explains core concepts such as positive and negative correlation, degree and direction of relationship, scatter diagrams, Karl Pearson’s coefficient of correlation, and Spearman’s rank correlation. The content is structured through a large number of objective questions that reflect common exam patterns and frequently tested ideas. Correlation Ans
I am writing about this PDF because correlation is a topic where students often memorise formulas without understanding what the values actually mean. This document repeatedly tests interpretation, logic, and application rather than long theory. By going through these questions, students learn how to judge the strength and direction of relationships, avoid confusing correlation with causation, and choose the correct method based on the nature of data. It makes the chapter much clearer and more scoring from an exam point of view.
Meaning of Correlation as Explained in the PDF
The PDF defines correlation as the statistical measure of covariation between two or more variables. It clearly states that correlation shows the degree and direction of relationship but does not establish cause and effect. This point is repeated through multiple questions to ensure conceptual clarity.
Direction of Correlation
According to the PDF, correlation can move in three directions:
- Positive correlation, where both variables increase or decrease together
- Negative correlation, where one variable increases while the other decreases
- Zero correlation, where no relationship exists
Examples such as temperature and sale of cold drinks, price and demand, and shoe size and intelligence are used to test understanding.
Degree of Correlation
The PDF explains that the degree or strength of correlation is measured by the value of the correlation coefficient. It always lies between –1 and +1.
Based on value, correlation is classified as:
- Perfect correlation
- High degree correlation
- Moderate degree correlation
- Low degree correlation
Questions frequently ask students to interpret values like 0.80, 0.39, –0.20, and –0.95.
Types of Correlation Covered
The PDF discusses several types of correlation, including:
- Simple correlation involving two variables
- Multiple correlation involving more than two variables
- Linear correlation where variables change in constant proportion
- Non-linear correlation where the rate of change is not constant
- Spurious correlation where relationship exists without logical connection
These distinctions are tested using real-life examples.
Download this Correlation PDF File: Click Here
Scatter Diagram Method
Scatter diagram is explained as a graphical method of studying correlation. The PDF highlights that:
- Independent variable is plotted on the X-axis
- Scatter diagrams show direction and approximate degree of correlation
- They do not give an exact numerical value
Several diagrams in the PDF ask students to identify whether correlation is high, low, positive, negative, or zero.
Karl Pearson’s Coefficient of Correlation
A large portion of the PDF focuses on Karl Pearson’s coefficient, also called the product moment correlation coefficient. The PDF explains:
- Its formula and interpretation
- That it is independent of change of origin and scale
- That it is suitable for quantitative data
- That it is affected by extreme values
It is presented as the most commonly used method for measuring linear correlation.
Spearman’s Rank Correlation
The PDF also covers Spearman’s rank correlation coefficient, which is used when:
- Data is qualitative
- Variables cannot be measured precisely
- Ranking is more meaningful than actual values
Examples include ranking students, judges’ opinions, and beauty contests.
Relationship Between Correlation and Regression
Several questions explain the link between correlation and regression. The PDF clearly states that:
- Correlation coefficient is the geometric mean of regression coefficients
- Regression coefficients always have the same sign
- Correlation measures association, not prediction
These concepts are tested as true-false and conceptual MCQs.
Important Points Repeated in the PDF
The PDF repeatedly reinforces that:
- Correlation does not imply causation
- Correlation coefficient has no units
- It is independent of change of origin and scale
- Perfect correlation exists only when variables change in the same proportion
This repetition helps strengthen exam confidence.