Correlation is a core topic in statistics and economics that explains how two or more variables are related to each other. The uploaded PDF is entirely focused on Correlation and is presented as an extensive question-based resource. It covers definitions, types of correlation, degree and direction of relationship, graphical methods like scatter diagrams, and mathematical measures such as Karl Pearson’s coefficient and Spearman’s rank correlation. The questions span conceptual understanding, numerical interpretation, and practical examples commonly asked in exams. Correlation Que
I am writing about this PDF because correlation is often misunderstood as causation, which the document repeatedly clarifies is incorrect. This PDF is clearly designed to train students to identify the nature, direction, and strength of relationships between variables without making wrong assumptions. By going through a wide range of objective questions, learners get clarity on what correlation really measures and how different methods are applied depending on the data type and situation.
Meaning of Correlation as Covered in the PDF
The PDF defines correlation as the statistical study of the relationship between two or more variables. It focuses on measuring the direction and degree of association, not cause and effect. Several questions clearly state that correlation measures covariation and not causation, which is a key conceptual point tested repeatedly.
Direction of Correlation
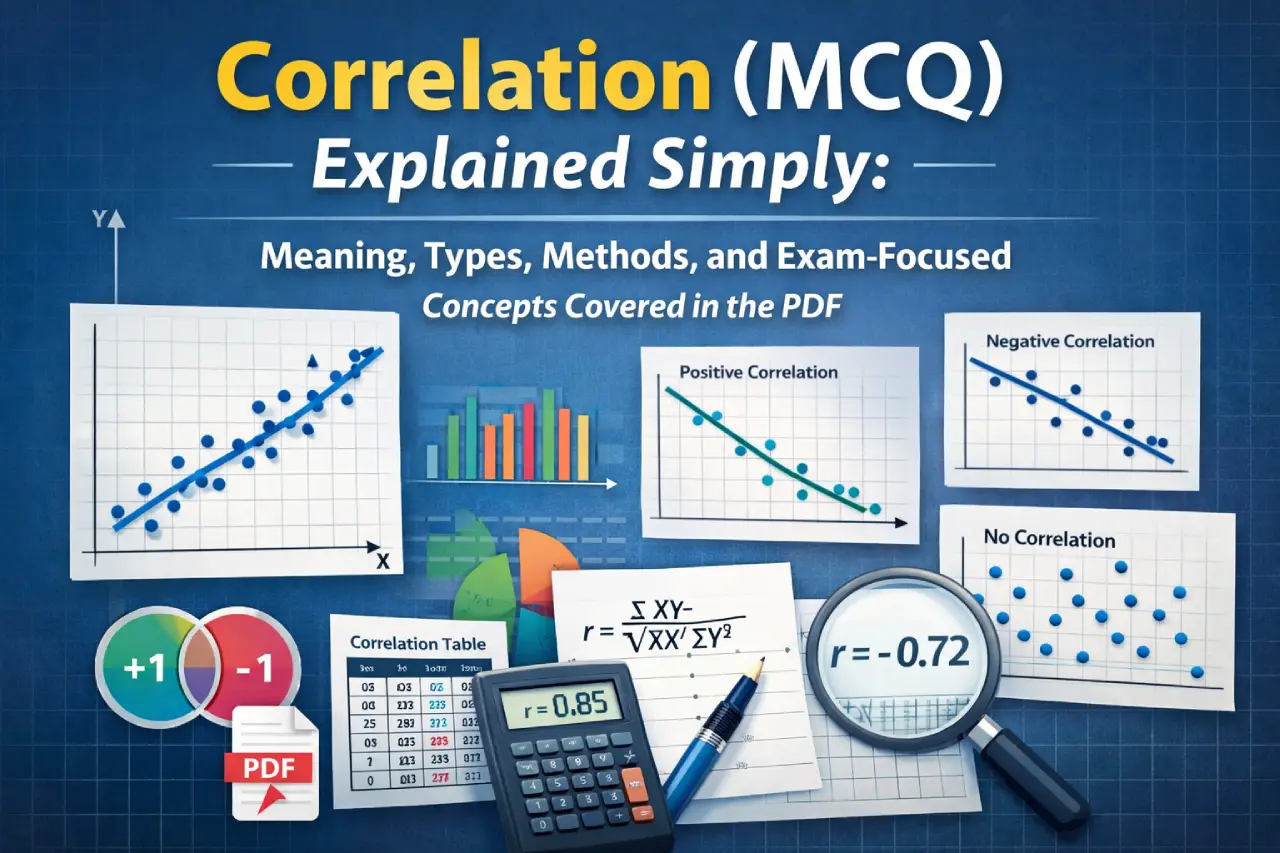
The PDF explains three possible directions of correlation:
- Positive correlation, where both variables move in the same direction
- Negative correlation, where one variable increases while the other decreases
- Zero correlation, where no relationship exists
Examples such as income and standard of living, price and demand, and temperature with sales are used to test understanding.
Degree of Correlation
A major portion of the PDF focuses on the degree or strength of correlation, measured through the value of the correlation coefficient. It clearly states that the coefficient of correlation always lies between –1 and +1.
The document classifies correlation into:
- Perfect correlation
- High degree correlation
- Moderate degree correlation
- Low degree correlation
Interpretation of numerical values like 0.80, 0.39, or –0.20 is tested multiple times.
Download this Correlation PDF File: Click Here
Types of Correlation Covered
The PDF includes questions on:
- Simple correlation, involving two variables
- Multiple correlation, involving more than two variables
- Linear correlation, where variables change in constant proportion
- Non-linear correlation, where the rate of change is not constant
- Spurious correlation, where relationship exists without logical connection
These distinctions are repeatedly tested through definitions and examples.
Scatter Diagram Method
The scatter diagram is discussed as a graphical method of studying correlation. The PDF explains that:
- Independent variable is taken on the X-axis
- Scatter diagrams show direction and rough degree of correlation
- They do not provide a precise numerical value
Several questions use diagrams to identify whether correlation is high, low, positive, negative, or zero.
Karl Pearson’s Coefficient of Correlation
A large number of questions focus on Karl Pearson’s coefficient, also known as the product moment correlation coefficient. The PDF covers:
- Its formula and interpretation
- Its independence from change of origin and scale
- Its use for quantitative data
- Its limitations, such as sensitivity to extreme values
It is shown as the most widely used method for measuring linear correlation.
Spearman’s Rank Correlation
The PDF also covers Spearman’s rank correlation coefficient, which is used when:
- Data is qualitative
- Variables cannot be measured precisely
- Ranks are more meaningful than actual values
It is especially highlighted for situations like ranking students or judging contests.
Correlation and Regression Relationship
Some questions in the PDF explain the relationship between correlation and regression. It is clearly stated that:
- Correlation coefficient is the geometric mean of regression coefficients
- The sign of regression coefficients is always the same
- Correlation does not depend on units of measurement
These are tested as conceptual true-false and MCQ items.
Key Points Repeated in the PDF
The PDF repeatedly reinforces that:
- Correlation does not imply causation
- Correlation can be positive, negative, or zero
- Perfect correlation exists only when variables change in the same proportion
- Scatter diagrams give visual but not exact measurement
This repetition helps strengthen exam readiness.